Page views don't tell the story
"User visited the pricing page" is five data points short of a narrative. Did they scroll? Did they linger? Did they tab away and come back? Were they idle while the tab was open? Did they bounce in 2 seconds or read for 4 minutes?
Most analytics tools leave you to guess. Some make you write custom event instrumentation to capture any of it. Onboardics captures all of it on install — no code, no schema, no maintenance — and gives you live visibility into every event as it happens.
What the snippet captures automatically
| Event | Fires when | Metadata |
|---|---|---|
scroll_depth |
On pagehide, reporting the max % scrolled on that page |
depth_bucket — 0 / 25 / 50 / 75 / 100 |
session_end |
On pagehide of the last page in a session |
session_duration_seconds, page_count, event_count |
idle |
2+ minutes of no keyboard / mouse activity while the tab is visible | Capped at 3 events per session |
visibility_change |
User tabs away or returns | state — hidden or visible |
rage_click |
3 clicks in under 500ms within a 30px radius | Element selector, text, coordinates |
time_on_page |
Every pagehide and SPA nav |
duration_seconds |
custom |
Whenever you call window.__onboardics.track(name, props) |
event_name plus any properties you pass |
Every event also carries the page_view baseline metadata from its session: UTM parameters, first-touch referrer, viewport dimensions, device type, detected framework. Nothing extra to wire up.
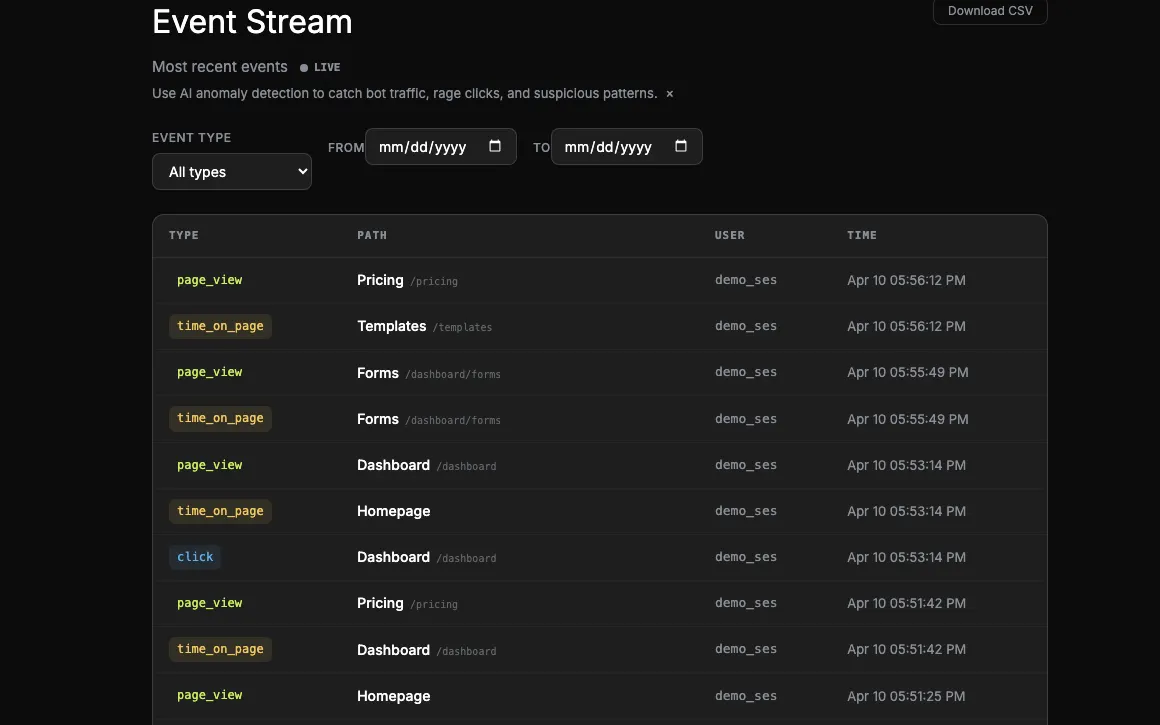
Live in the dashboard within 500ms
The Events page subscribes to a Supabase Realtime channel scoped to your project. Every /api/events insert pushes a postgres_changes notification over a WebSocket. New events appear in the stream in under half a second — no polling, no refresh button, no "rebuilding dashboard" delay.
A pulsing LIVE indicator shows the subscription is healthy. If you scroll down while new events arrive above, a floating "12 new events ↑" badge lets you jump back without losing your scroll position. 500ms is the buffer threshold we batch over — dropping below that was purely jitter from the UI rerender, not the pipeline.
This is different from how most analytics tools work. Amplitude, Mixpanel, PostHog Cloud all buffer server-side for minutes to hours before events show up in queryable form. Onboardics is an operational tool — you install the snippet, open the Events page, watch your first visitor in real time, and know immediately that things are wired up correctly.
Segments that unlock with engagement signals
- Engaged readers:
scroll_depth.depth_bucket ≥ 75on a blog or article page,time_on_page ≥ 60. Target with a modal: "Get more like this — join the list." - Bounced users:
session_end.page_count === 1andsession_duration_seconds < 10. These are paid-ads-traffic refugees. Target with a retargeting pixel instead of an in-app flow. - Distracted users: 2+
visibility_changeevents in one session. Tab-switchers comparing tabs. The moment they come back withstate: visible, fire a "Welcome back — here's what's new" tooltip. - Deep browsers:
session_end.page_count ≥ 5andsession_duration_seconds ≥ 180. Power-user behavior. Target with invite-your-team flows. - Idle stallers: users who hit
idleon a specific page (settings, checkout, etc.) — probably stuck figuring something out. Target with a contextual helper tooltip, or ping support. - Repeat rage clickers:
rage_clickon the same selector across 2+ sessions. Something is broken in the frontend — surface it to engineering before customers complain.
Custom events, when the defaults aren't enough
Product-specific actions — "invoice sent", "listing published", "video watched 80%" — are one function call away:
window.__onboardics.track('invoice_sent', { amount: 4200, plan: 'growth' });Custom events flow through the same pipeline, show up in the real-time stream with event_type = custom and metadata.event_name = invoice_sent, and are segmentable immediately. See Using custom events for a full walkthrough with SaaS / marketplace / content product examples.
Privacy-respecting by default
Engagement events participate in the same consent gate as every other event type. If setConsent(false) was called — or Termly auto-detection reads declined analytics consent — engagement events never fire. Form-field names captured in form_interaction events pass through a PII denylist (password, SSN, credit-card, etc.) before emission.
Everything we capture is detailed on the Security page. Nothing is hidden, nothing is opaque — you can read v1.js source.
Pricing
Rich engagement events and real-time streaming are available on all tiers including Free. They're part of the tracking snippet and the default dashboard — no plan-gate, no enterprise add-on, no polling-interval tier.