— The problem
You find out about churn after it's already happened. NPS surveys and quarterly business reviews are lagging indicators — by the time you call, the customer has already decided to leave. Your CRM tells you who cancelled, not who's about to. You need early warning signals, not post-mortem reports.
— What you get
- AI proposes which user journeys lead to retention vs churn — click "Suggest funnels with AI" and Onboardics inspects your real path + event data, ranks the multiple journeys operating in your product, and lets you accept the ones worth tracking. AI also proposes the audience segments worth defining at-risk plays for. Learn more →
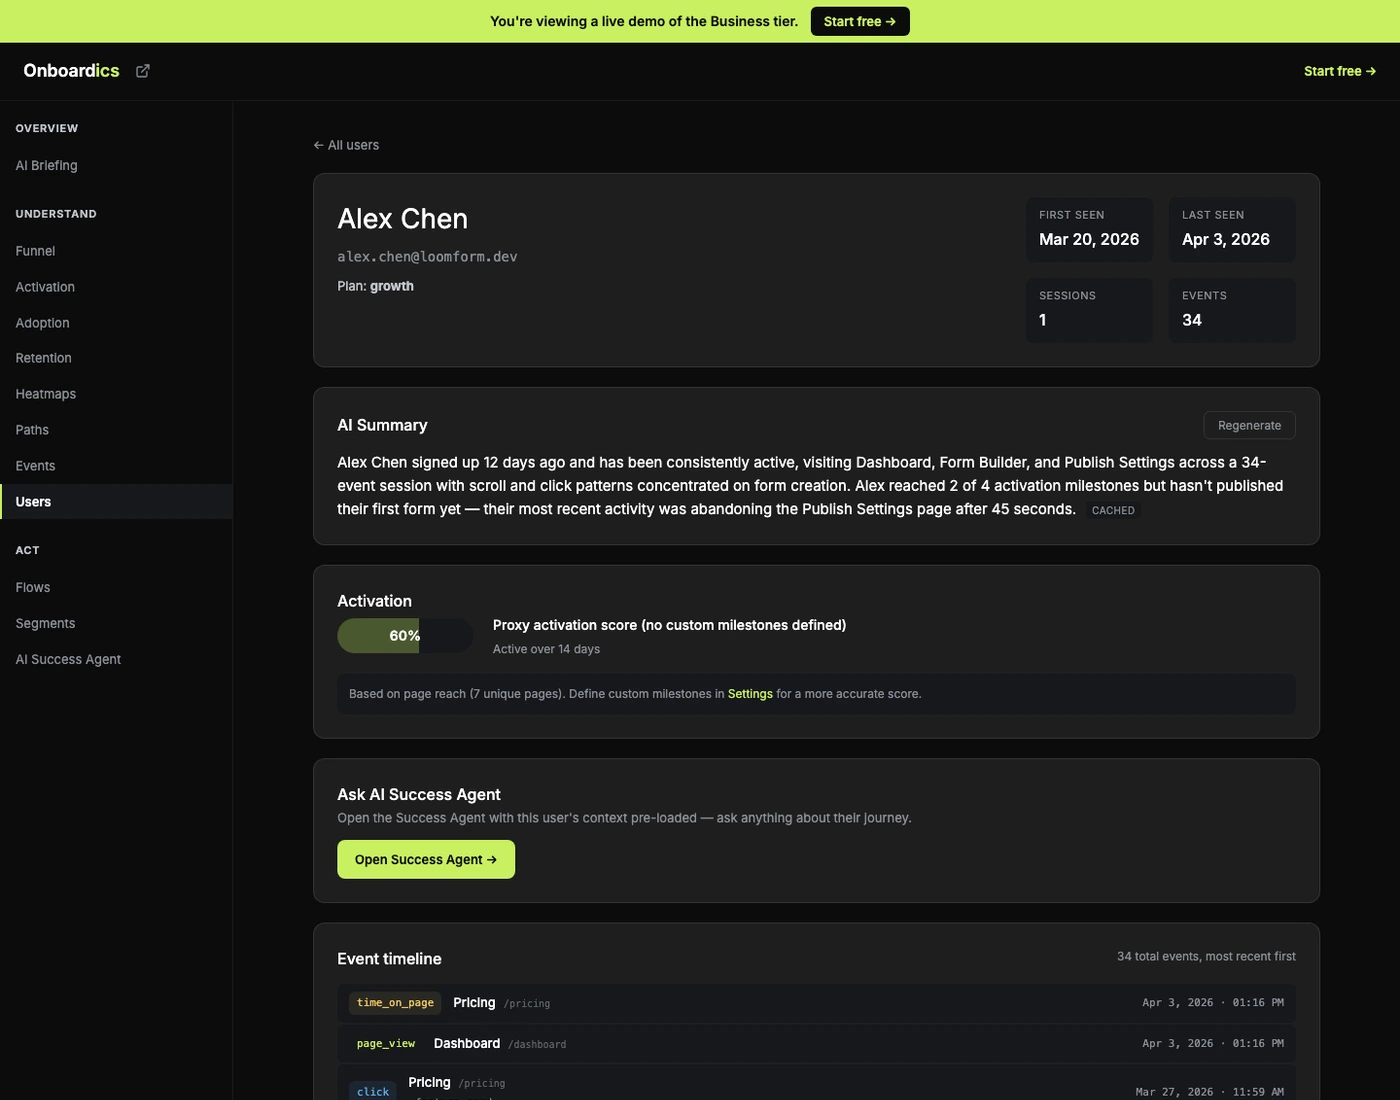
- Per-user detail pages — pull up any customer to see their full session timeline, activation state, onboarding score, segment membership, and an AI summary of their journey, split across Overview and Timeline tabs so you can skim the summary or drill the events without scrolling fatigue. The save-the-account workflow starts here. Learn more →
- Click-stream replay — deterministic playback of a customer's clicks, scrolls, rage-clicks, and exits. See exactly where they dropped off before the call. Scale+ adds AI diagnosis of each session. Learn more →
- AI Success Agent — ask questions about any account's behavior in natural language. "Which features has this customer stopped using?" "What's their retention trend over the last 30 days?" Available 24/7 without scheduling internal meetings. Learn more →
- Retention analytics — day-N retention curves by signup cohort. See whether onboarding improvements actually translate to users coming back. Compare cohorts to measure the impact of CS interventions. Learn more →
- Feature adoption tracking — see which features each customer actually uses versus ignores. Identify adoption gaps before they become churn signals. Learn more →
Champion customers often take a different path than the one CS playbooks assume.
— Visibility without edit access
Customer success teams need to see everything — funnel, event stream, retention, flows — but should not be able to accidentally change production flows or delete diagnoses. Shared logins get this wrong by giving everyone edit power.
Onboardics solves it with four role tiers. The Viewer role is purpose-built for CS: full read access across every dashboard, zero ability to modify. Promote a teammate to Editor when they need to build a save-the-account flow; demote back to Viewer when they don't. Growth includes up to 3 members, Scale 10, Business unlimited. Learn more about team collaboration →
— Move from reactive to proactive
Most CS tools tell you who churned. Onboardics tells you who's about to. AI identifies engagement drops, feature abandonment, and adoption plateaus as they happen — not weeks later in a quarterly review. You'll know which accounts need attention before the customer even thinks about leaving.
The AI Success Agent queries 9 data dimensions per message — funnel, events, sessions, paths, retention, cohorts, heatmaps, milestones, and flows. Ask it anything about any account, any time.
— Your CS playbook, automated
- At-risk account alerts — Slack notifications when engagement drops below baseline
- Per-user timelines — open any account and see every event in chronological order, activation state, and an AI-written summary of where they are in your product
- Session replays — watch the exact click-stream that led to a support ticket or churn signal
- Onboarding completion tracking — see exactly where each customer dropped off in your onboarding flow
- Feature adoption gaps — identify customers who haven't discovered key features and trigger targeted in-app guidance
- Expansion opportunity identification — spot customers who've outgrown their current tier
- AI-powered health reports — weekly digest with account-level engagement trends
Your CS command center
- Per-user timelines with AI summary + onboarding score
- Click-stream replay for any session
- Day-N retention curves by signup cohort
- Feature adoption tracking per customer
- AI Success Agent for account-level questions
- Slack alerts for engagement drops
Deploy · $249/mo
Deploy gives CS teams the no-code flow builder to catch frustration churn before it converts to a support ticket: target a modal at “users who hit a JS error before completing onboarding”, surface a tooltip on a stalled feature, run an A/B test to measure which intervention saved the most accounts. Pair with AI-defined audience segments to send the right message to the right cohort. 5,000 MAU, up to 3 team members, 90-day retention. 14-day free trial with card required.
Need Slack alerts the moment a churn-risk segment spikes? Upgrade to Scale ($449).
Join waitlist