Activation went up. But are they coming back?
You shipped a new onboarding flow last month. Activation went up. But are those users actually coming back? Without cohort-level retention curves, you can't tell whether activation improvements translate to long-term engagement.
How Retention & Cohort Analysis works
Automatic cohort grouping
Users are automatically grouped by the week they first appeared in your data. No manual cohort definition — Onboardics builds cohorts continuously as new users arrive.
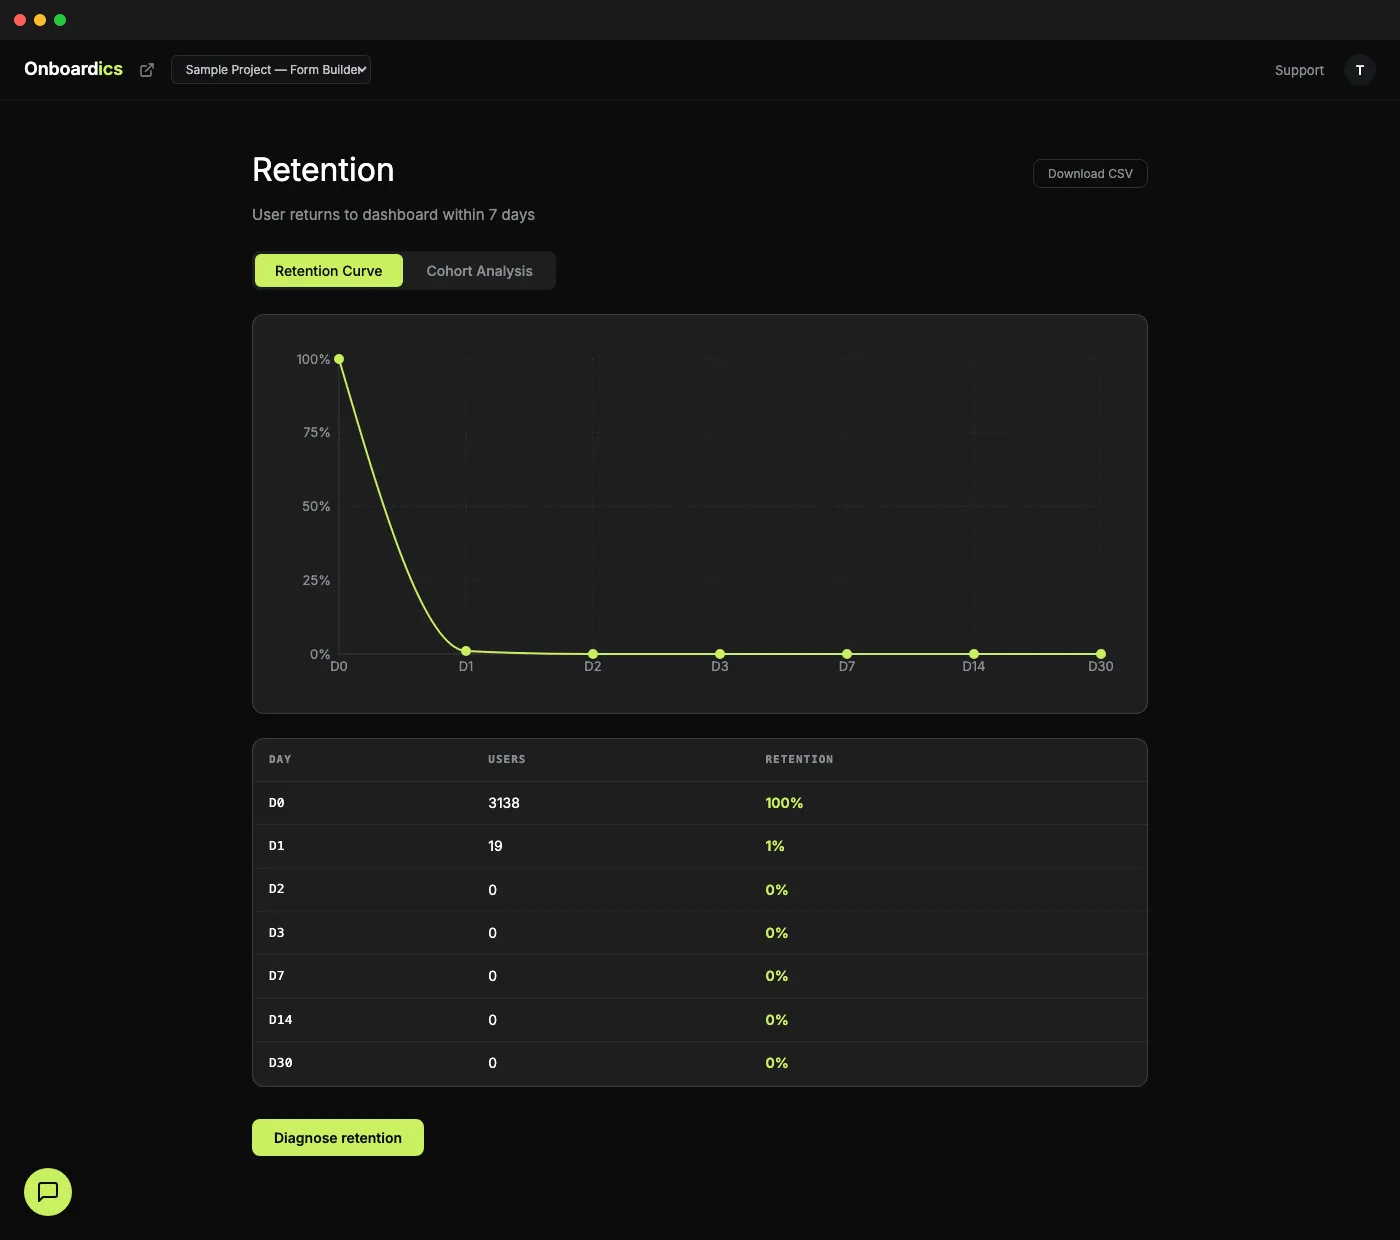
Day-N retention curves
See what percentage of each cohort returns on day 1, 7, 14, and 30. Curves update as sessions come in, so you always see the current retention picture for each cohort.
Compare cohorts
Overlay cohorts to see whether changes you shipped — new flows, UI changes, onboarding tweaks — actually improved retention in cohorts acquired after the change.
What you get
- Day-N retention curves — day 1, 7, 14, 30 retention per cohort
- Automatic cohort grouping by first-seen week — no configuration required
- Cohort comparison overlays — visualize the impact of product changes over time
- Customizable retention definition via AI-defined metrics — describe "retained" in plain English
- AI-powered retention diagnosis — contextual analysis of why retention is dropping
- CSV export for reporting and external analysis
Pricing
Retention Curves and Cohort Analysis are available on Diagnose ($149/mo) and above — the entire AI analytics suite ships at the Diagnose tier. Scale ($449/mo) and above include unlimited data retention so your cohort history never gets deleted.