The problem with generic metrics
Every product analytics tool ships with generic metrics that don't match how your business actually works. "Page views" isn't activation. "Session duration" isn't engagement. You end up building spreadsheets on top of your analytics tool, manually mapping proxy metrics to what you actually care about.
How it works
Describe your metrics
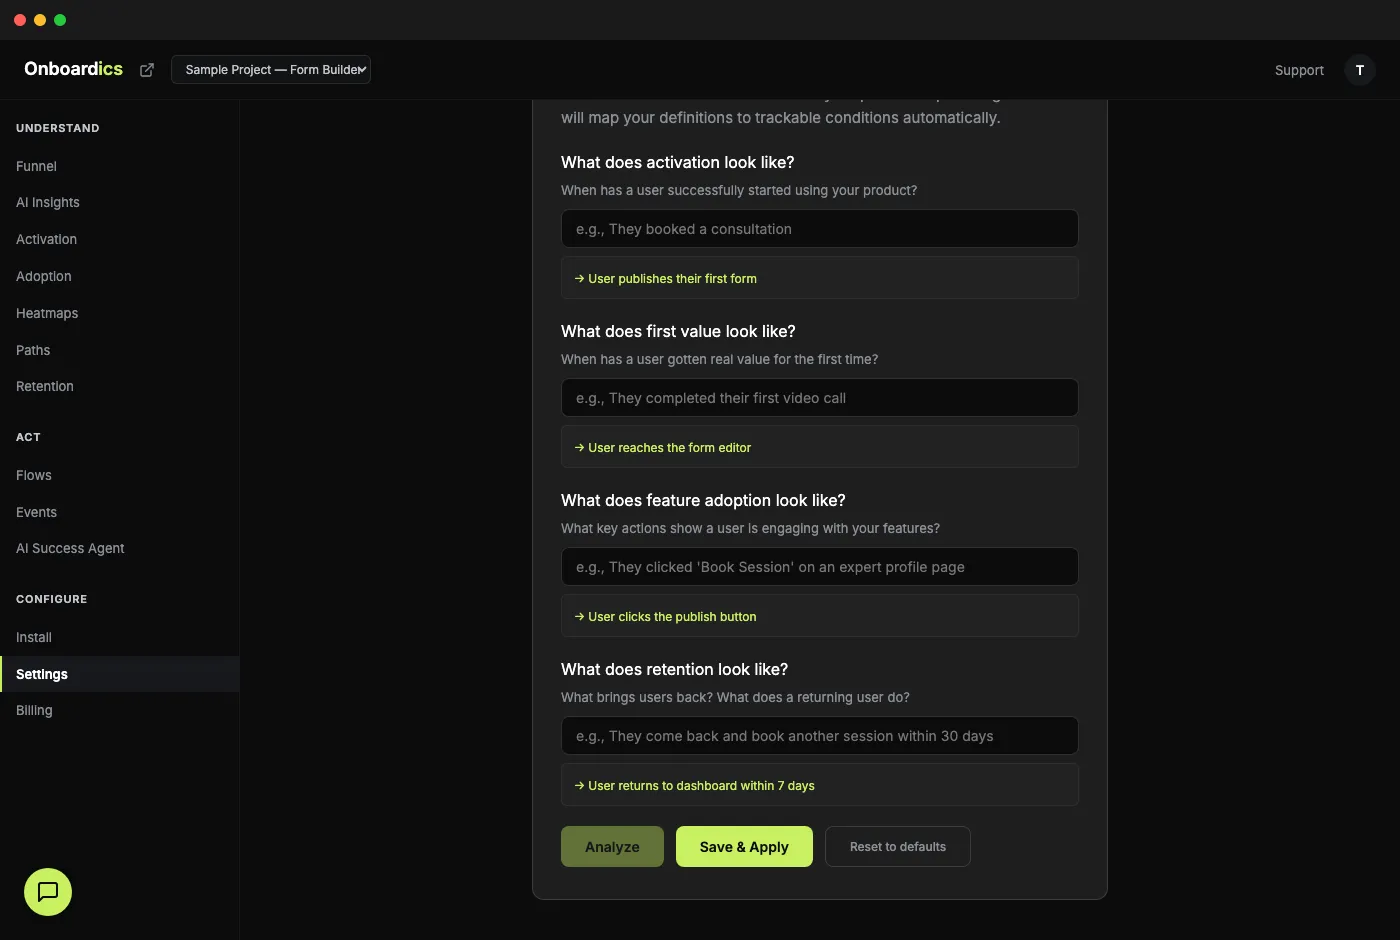
Go to Settings → Define Your Metrics and type what success looks like in plain English. Example: "Activation means they booked a consultation. Retention means they came back and booked another session within 30 days."
AI translates to rules
Our AI analyzes your project's actual event data — page views, clicks, navigation paths — and maps your description to trackable conditions automatically. No event tagging, no custom code, no analytics engineer required.
Dashboard rebuilds
Your Activation, Adoption, and Retention pages all update their labels and calculations to use your definitions. "Median time to first interaction" becomes "Median time to first booking." The dashboard speaks your language.
Real example
"Activation means they booked a consultation. First value is when they complete their first video call. Feature adoption means they clicked 'Book Session' on an expert profile page. Retention is when they come back and book another session within 30 days."
What this unlocks
- Activation rate that matches YOUR definition of activated
- Time to value measured against YOUR real "value" moment
- Feature adoption tracked against YOUR key actions, not generic page visits
- Retention measured against meaningful return behavior, not just any page view
- All dashboard subtitles update dynamically — "% of sessions reaching activation" becomes "% of users who booked a consultation"
- AI suggests definitions based on your actual event data if you're not sure where to start
How this is different
Other product analytics tools require you to write code, set up custom event tracking, or hire an analytics engineer to define your activation metrics. Onboardics asks you to write a sentence.
Pricing
Custom metrics are available on Diagnose ($149/mo) and above.