You know the rate — not the reason
You know some users activate and some don't. But you can't tell WHERE in the journey they get stuck, HOW LONG it takes the successful ones, or WHAT distinguishes users who activate from those who don't.
How Activation Metrics works
Define activation
Use AI custom metrics to describe your activation milestone in plain English, or start immediately with the default proxy metric — sessions reaching 3+ unique pages.
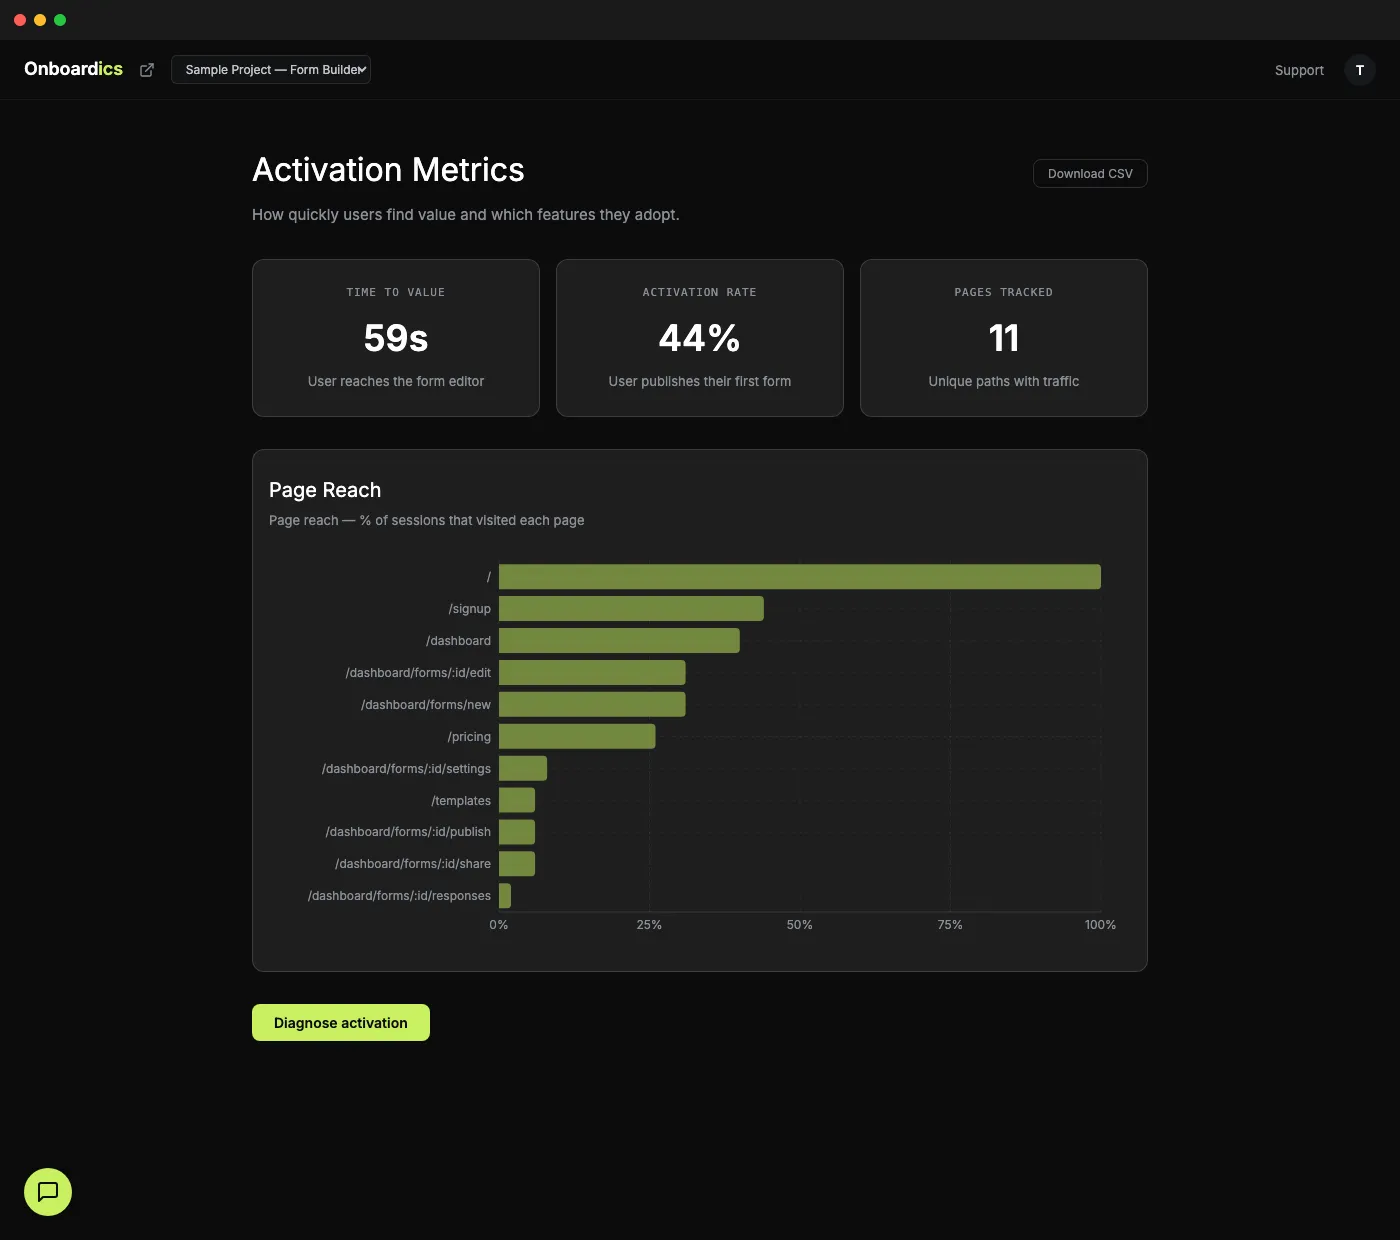
Track the funnel
Activation rate, median time to value, and milestone completion rates update automatically as new sessions come in. No manual report building.
AI diagnoses bottlenecks
Click the contextual Diagnose button to get a plain-English analysis of why users fail to activate — with specific recommendations ranked by impact and effort.
What you get
- Activation rate tracking — % of sessions reaching your activation milestone
- Median time to value — how long it takes successful users to activate
- Milestone completion rates — step-by-step breakdown of where users drop out
- Customizable via AI-defined metrics — describe activation in plain English
- Contextual AI diagnosis — one click to understand why activation rate is low
- CSV export — download activation data for reporting or external analysis
- Pagination — fetches all events past Supabase's default row limit for accuracy
Pricing
Activation Metrics is available on Diagnose ($149/mo) and all higher tiers. AI-defined custom metrics (to replace the default proxy metric with your own definition) are also included on Diagnose and above.