01 — Built around AI from day one
Most product analytics tools were built around dashboards and charts, then added AI as an afterthought — a chatbot here, a generated summary there. Onboardics was designed from the ground up with AI as the core product, not an add-on.
What this means practically: you don't need to know SQL. You don't need to define funnels manually. You don't need to tag features or build a data taxonomy. The AI maps your user journey automatically, diagnoses where users drop off and why, and hands you the exact change to make — specific copy, CSS selectors, suggested page placement — all from one line of JavaScript.
Every analytics page has a one-click AI diagnosis. Every diagnosis produces fix recommendations ranked by impact, with copy and selectors so engineering can ship in code. On Deploy and above, every recommendation also gets a “Create flow” button that builds a deployable tooltip, tour, or modal — making the entire pipeline, from raw data to shipped fix, fully no-code.
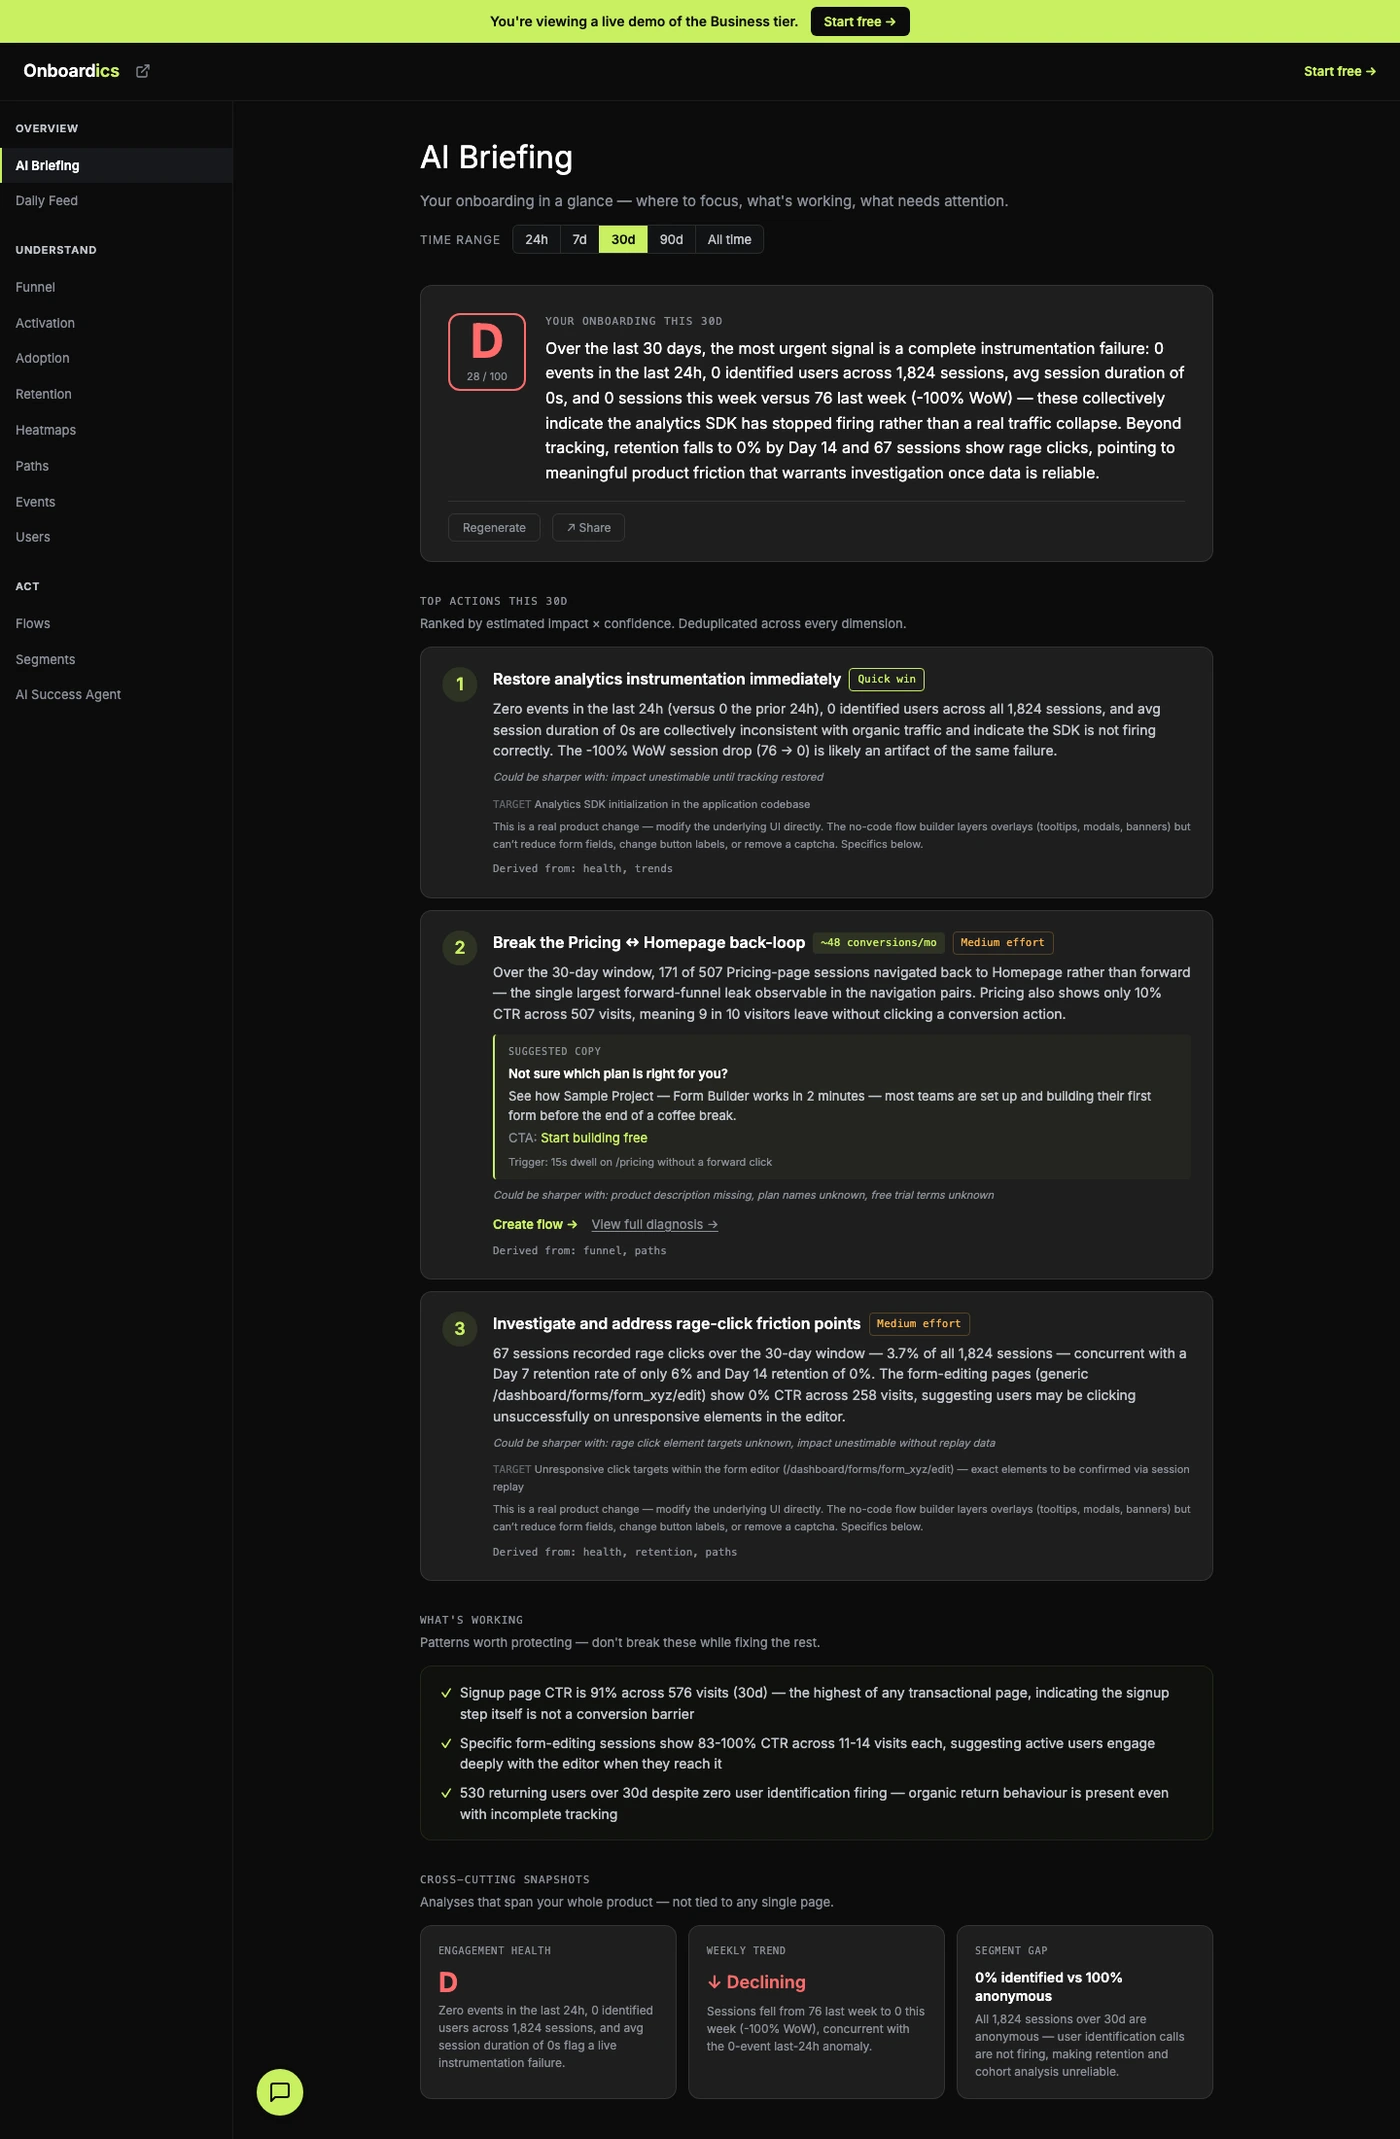
The AI Briefing — grade, verdict, and top 3 actions synthesized in one view.
02 — Beyond the funnel you'd build by hand
Most analytics tools start where you start: you define a funnel, you see the chart. Onboardics goes further — AI inspects your real path + event_type data and proposes the additional funnels operating in your product. Marketplace products have demand-side and supply-side journeys. SaaS has signup, activation, upgrade. Content products have anonymous browse and authenticated read.
Accept the ones worth tracking; ignore the rest. Each accepted funnel becomes its own dashboard, drop-off chart, and AI Briefing — tracked independently. The same pattern works for audience segments: AI surfaces the cohorts worth defining from real engagement signals (visit_count distribution, identify properties, page-set affinity), each one ranked by confidence.
03 — Define your metrics in plain English
This is where Onboardics is fundamentally different from every other analytics tool in the category.
Instead of forcing your business into pre-built metric definitions, you tell Onboardics what success looks like — in a sentence. “Activation means they booked a consultation.” “Retention means they came back and booked another session within 30 days.”
The AI analyzes your actual event data, translates your description into measurement rules, and your entire dashboard rebuilds around it. Activation rate, time to value, feature adoption, retention curves — all recalculated against YOUR definitions. No custom events. No data taxonomy. No analytics engineer. Just a sentence.
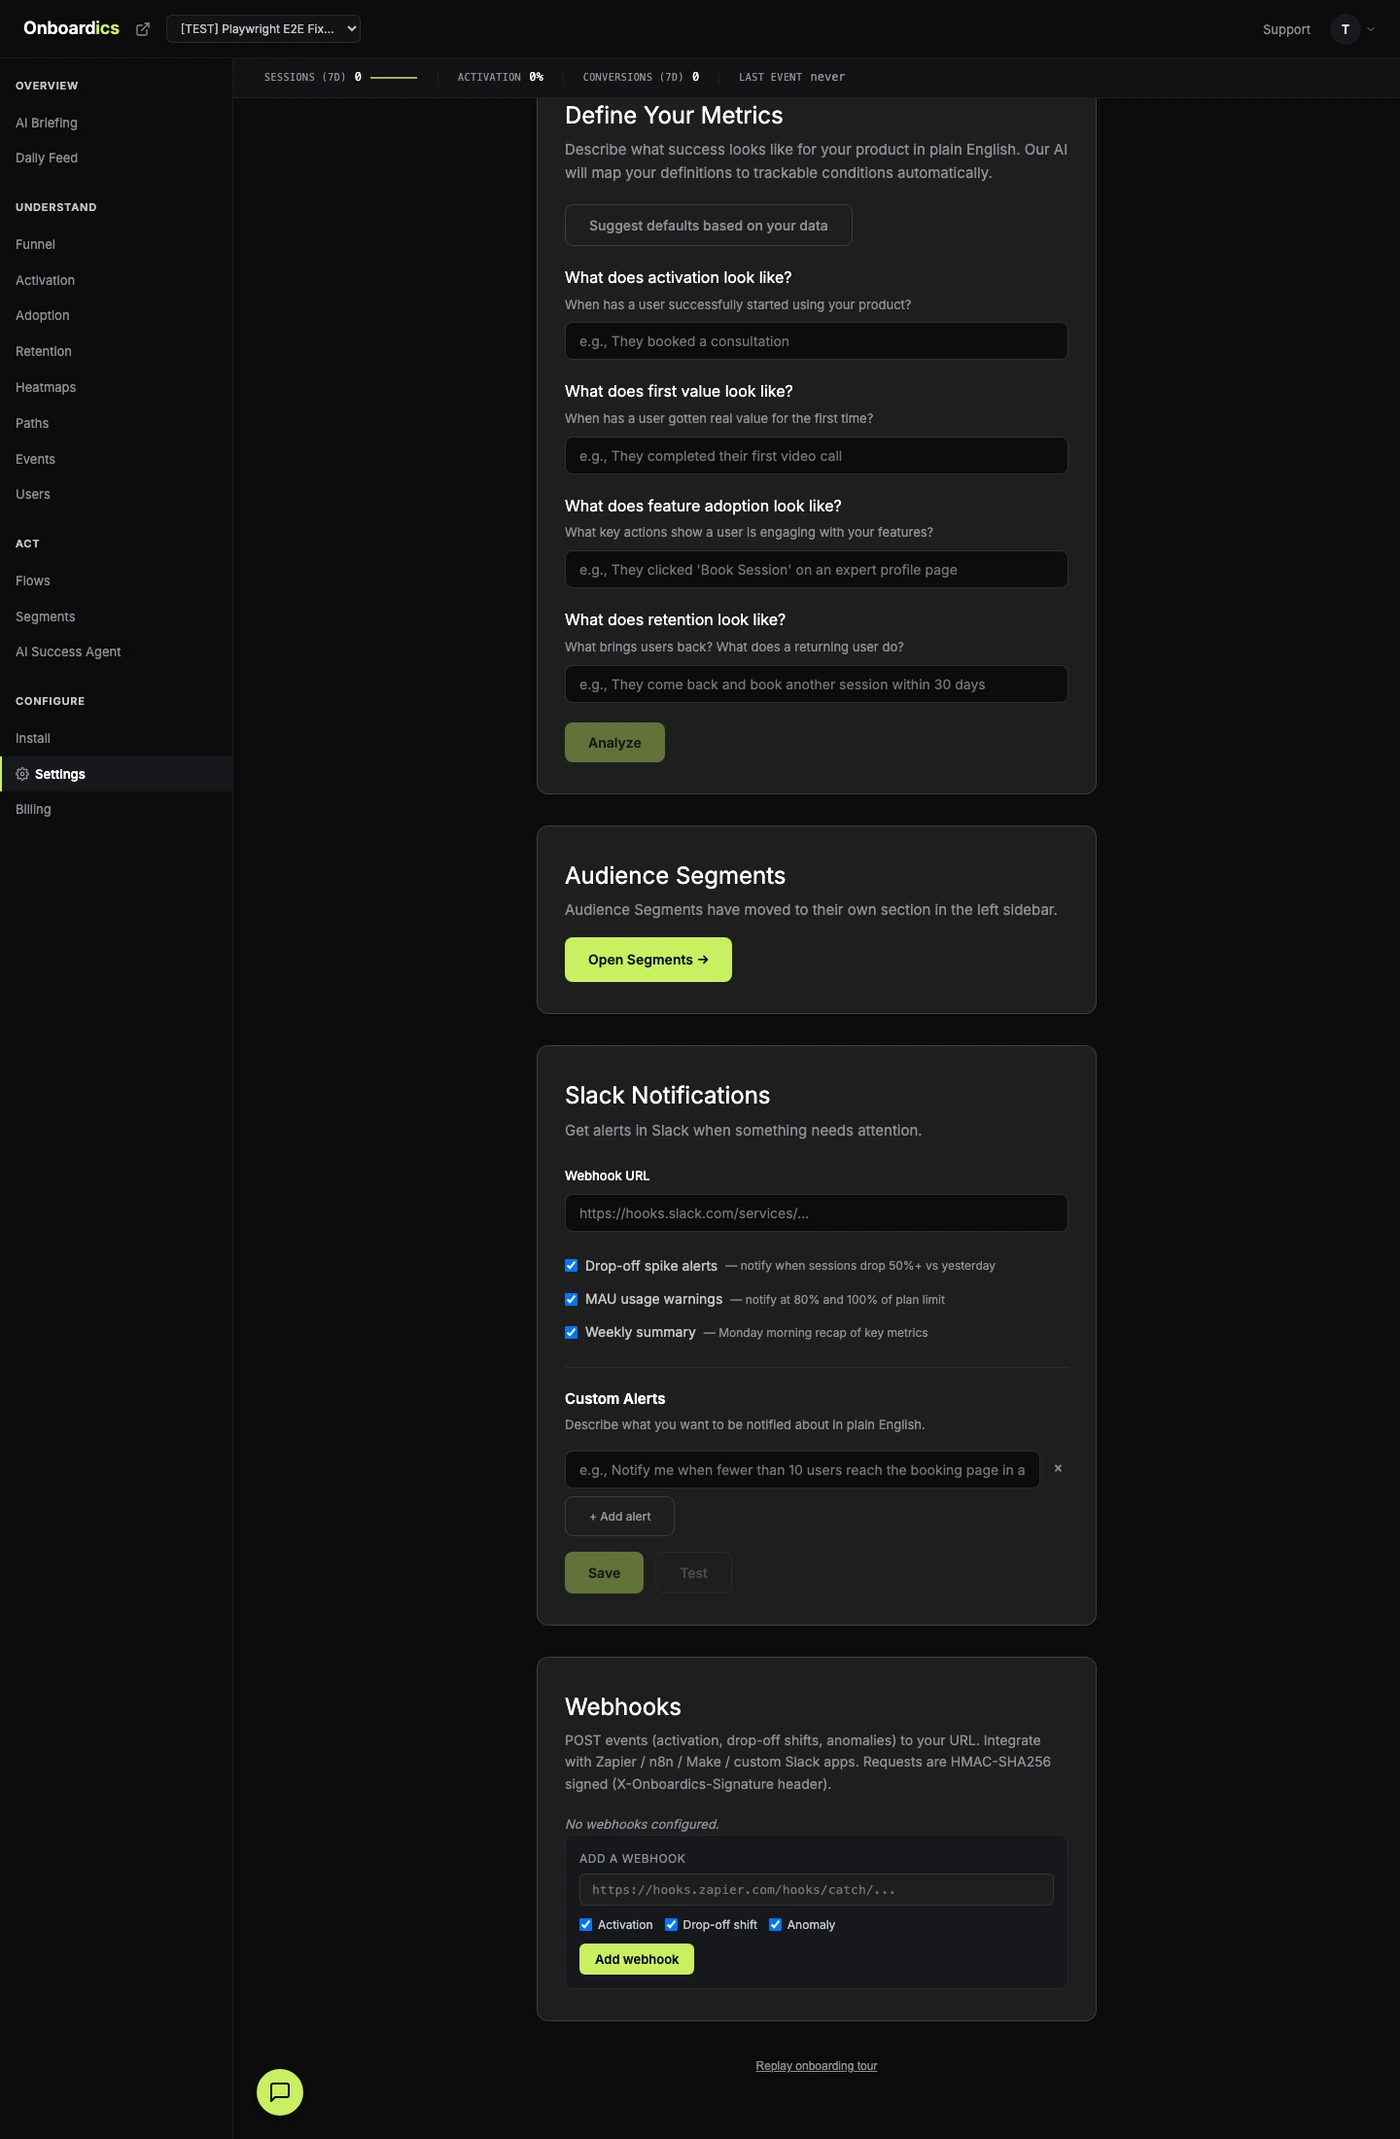
Define your metrics in plain English — AI handles the rest.
04 — The old way vs. Onboardics
Other analytics tools
- Multi-week implementation with SDK setup
- Show you the funnel you defined
- Define custom events and data taxonomy
- Hire an analytics engineer to maintain it
- Write SQL queries to answer questions
- Build dashboards manually
- Filter by the segments you've already built
- Show you that the line went down without explaining why
Onboardics
- One-line install, data flows in seconds
- Surface the additional funnels operating in your product — demand-side, supply-side, content, upgrade — and let you accept the ones that match
- Propose the audience segments worth defining from real engagement signals
- Define metrics in plain English
- AI tells you why users leave, scoped to the funnel + segment you picked
- AI generates fix recommendations you ship in code (Diagnose) or no-code flows in minutes (Deploy and above)
- Free tier, transparent pricing
05 — From insight to action, on your terms
Most analytics tools stop at observation. They show you a chart going down and leave you to figure out why. Even the ones with AI summaries still leave the “now what?” question unanswered.
Onboardics closes the loop. Every AI diagnosis comes with specific fix recommendations — not vague advice like “improve your onboarding”, but concrete actions like “add a tooltip explaining that publishing is free, estimated impact: 220 recovered conversions/month.”
Every recommendation includes the suggested copy and the CSS selector for the target element — on Diagnose, ship the fix in code on your own timeline. On Deploy and above, when the fix is overlay-able, click the “Create flow →” button and the no-code flow builder generates a tooltip, modal, or guided tour pre-populated with the suggested copy. Customize if you want, then deploy — the overlay is live in 5 minutes, no waiting for a deploy cycle.
Competitors sell you an overlay for every problem. We tell you when an overlay is the wrong answer.
Some fixes need a real product change — fewer form fields, a different layout, a removed step. The AI flags those as code-only. We’d rather hand engineering an honest spec than sell you a tooltip that papers over the actual problem.
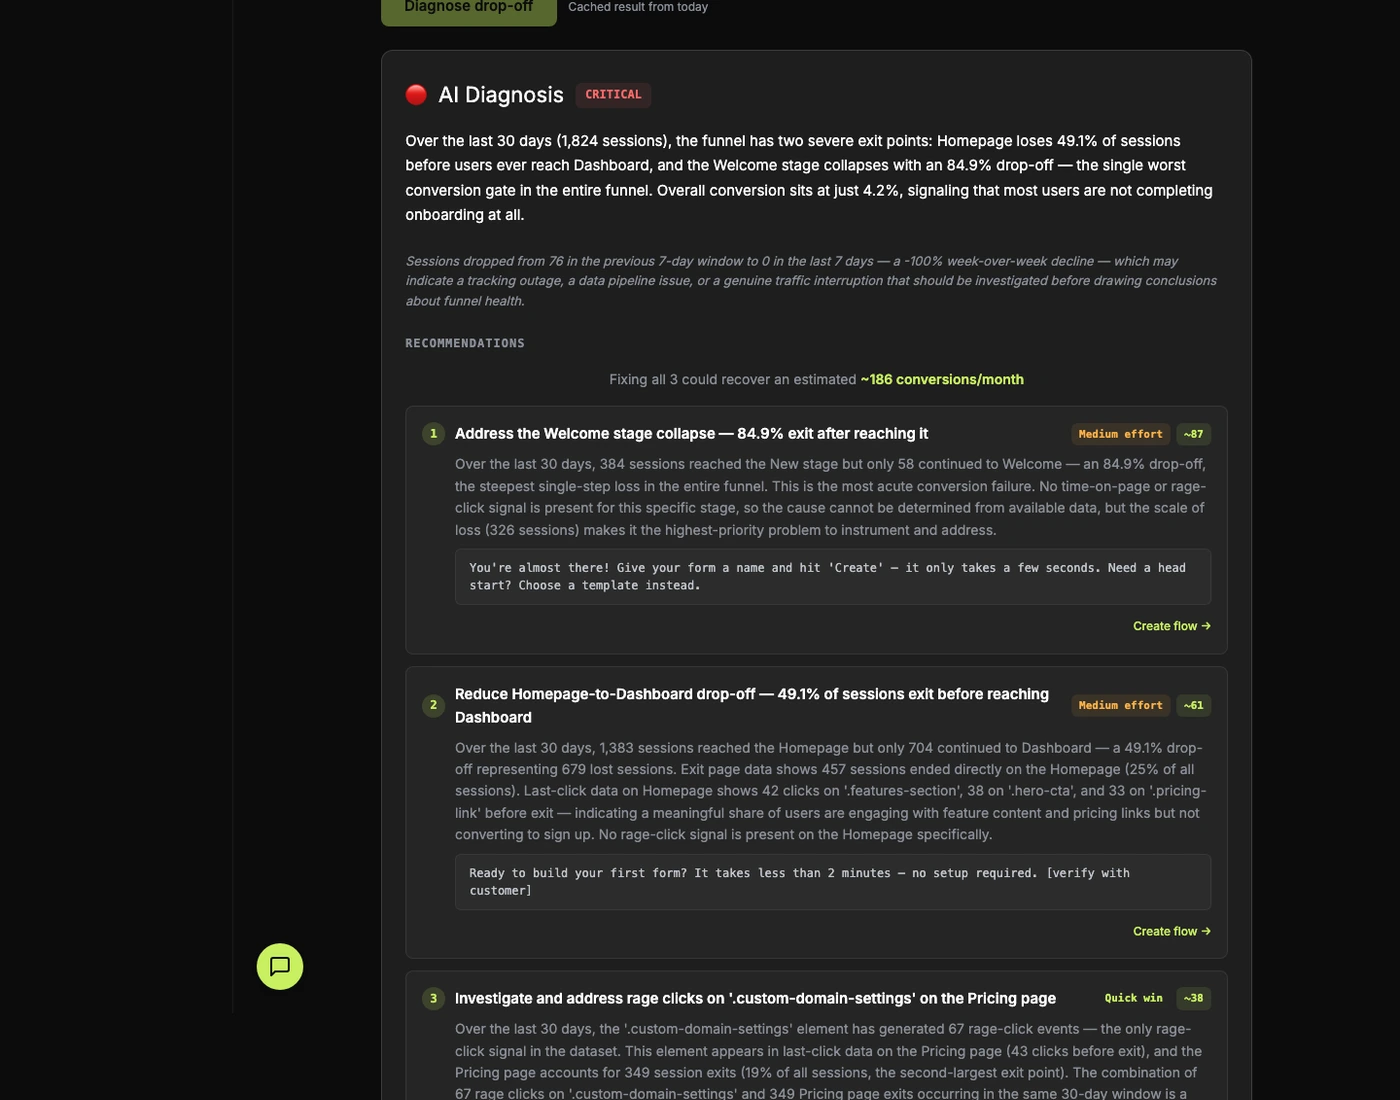
AI diagnosis — with “Create flow →” on overlay-able fixes (Deploy and above) and code spec on every recommendation.
Learn more about the no-code flow builder →
Wondering whether the diagnosis is worth the install effort? Calculate the ROI yourself → — three numbers, no email required for the calculator itself.
06 — One-line install, real data in minutes
Paste one line of JavaScript. That's the entire setup. No SDK configuration, no developer tickets, no implementation consultants, no multi-week onboarding program. Your data starts flowing in seconds — page views, clicks, navigation paths, all mapped automatically.
Most analytics platforms require days or weeks of instrumentation before you see your first insight: define events, tag elements, build funnels, configure dashboards. Onboardics shows you your funnel the moment you install. The AI detects your conversion flow automatically, identifies drop-off points, and runs its first diagnosis without any manual setup.
07 — Transparent pricing, free tier, no sales calls
Our pricing is on our website. Free tier with 250 MAU, no credit card required. Paid tiers start at $149/month. No sales calls required to see numbers. No “contact us for pricing” walls. No annual contract minimums.
This is unusual in the category. Most product analytics tools hide their pricing behind demo request forms — you can't even see the number without scheduling a call. We think if you have to hide your price, it's because you know it will scare people. Ours won't.
08 — Privacy-first by default, not a settings page you have to remember
Others in this category typically treat privacy as a configuration surface. You install, then you wire up consent, then you audit what's being captured, then you hope the next SDK update doesn't change the defaults. Onboardics inverts this: the snippet ships with a consent gate on by default, honors navigator.globalPrivacyControl, auto-detects Termly's consent state with zero wiring, and captures form fields through a denylist that blocks passwords, SSNs, and credit-card fields at the source.
JS errors are captured automatically — but a nine-pattern redaction chain strips Bearer tokens, API keys, URL query-string secrets, emails, UUIDs, credit-card-like sequences, phone numbers, and file paths before the error leaves the browser. You get pre-support-ticket visibility into customer-facing bugs without pulling customer data into your analytics pipeline. And for teams with strict content security requirements, the snippet is published at a hashed URL with an SHA-384 integrity attribute you can pin in your <script> tag.
Most tools in this space make you earn privacy through configuration. We think it should be the floor, not a feature.
09 — Real results from day one
“I assumed I knew where the leak was. Then I ran the SQL.”Onboardics founder — on the Hodego pilot funnel
The Hodego pilot logged 4 conversions out of 233 sessions across six weeks. The funnel that actually moved them through wasn’t the one you’d map by hand — it had one fewer stage, and the real leak landed where the data said, not where a mental model said. All four converters followed the same exact path: / → /explore → /expert/[name] → /login → /booking/confirmed.
Onboardics auto-detects the funnels operating in your data and ranks them by traffic. Including the ones you’d build, the ones you’d miss, and the ones you’d misread. The discovery half is what nobody else does.